Oracle Application Express (Oracle APEX) is the web application development tool for the Oracle database. We use the tool to design, develop and deploy database-driven applications, either on-premise or in the cloud. Using only a web browser and with limited programming experience, you can rapidly develop and deploy professional applications that are both fast and secure for any device from desktop to mobile.
Occasionally, unexpected errors can occur in Oracle Application Express. These can be hard to trace. As Apex developers, we try to handle them as much as we can by showing meaningful messages for the user. At times, without proper handling, the user will be shown a more generic message such as “Contact your Administration”. In order to identify and debug the error, Apex provides a debug page in App Builder section to check all backend messages and logins. This can help with diagnostics.
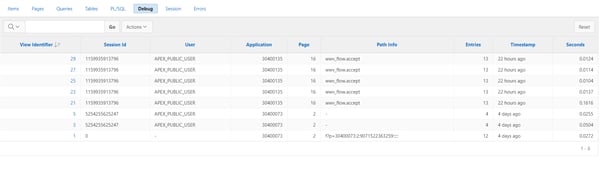
All log messages are grouped by requests. That means in the first view of this Debug page are all requests made by users. Once you have this, you need to “View Identifier” in order to check all messages which happened during that request:
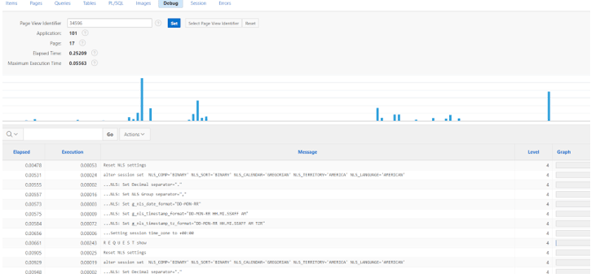
Although we can find in this page almost all logging messages, there are times where you may wish to search by a specific message within a couple of requests made by the user. In this case, you will need to open requests one by one to find exactly when the error occurred to facilitate analysis. This may be a painful process if your app is being used by hundreds of users at the same time.
Instead of using the APEX interface, we can actually query for all this information from the database. We can use two database views to query all information shown in the Debug page:
select * from APEX_WORKSPACE_ACTIVITY_LOG
select * from APEX_DEBUG_MESSAGES
The APEX_WORKSPACE_ACTIVITY_LOG will provide information regarding the requests (first view of the Debug page) and APEX_DEBUG_MESSAGES (the view when clicking the View Identifier link) shows all messages within requests.
It is possible to merge these 2 views using this join:
APEX_WORKSPACE_ACTIVITY_LOG.DEBUG_PAGE_VIEW_ID=apex_debug_messages.PAGE_VIEW_ID
So in summary, we can use this query to fetch all logging messages and show the related user/page/app/time (and the message itself):
select
apex_debug_messages.APEX_USER,
apex_debug_messages.APPLICATION_ID,
APEX_WORKSPACE_ACTIVITY_LOG.APPLICATION_NAME,
apex_debug_messages.PAGE_ID,
apex_debug_messages.MESSAGE,
apex_debug_messages.MESSAGE_TIMESTAMP,
apex_debug_messages.PAGE_VIEW_ID,
apex_debug_messages.SESSION_ID
from APEX_WORKSPACE_ACTIVITY_LOG
inner join apex_debug_messages on APEX_WORKSPACE_ACTIVITY_LOG.DEBUG_PAGE_VIEW_ID = apex_debug_messages.PAGE_VIEW_ID
This view provides more details than Out-of-the-Box approach, and we can now adjust the query to retrieve all required information.
Now that we have all log information in one view, we can query by any parameters - the app, page, time, user or message (you can also check the stack trace of a message using the column CALL_STACK in APEX_DEBUG_MESSAGES view).
To make it even easier to find an exception and its details, we’ve created an APEX app with an Interactive Grid (configured with the query above). With the help of this app we are able to easily do a search without the necessity of going to the databases and write a query: 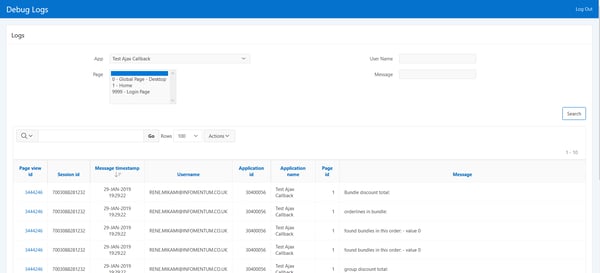
We hope you found this blog post useful. Let us know if you have any questions.