
Successful software delivery is based on careful planning, accurate estimation and a good understanding of what is in and out of scope. In traditional project management, projects are broken into work packages and assigned to specialists for sizing and estimation. These packages are in turn broken up into progressively smaller modules to get increasingly more accurate sizing. After that, all the sizings are rolled up, and a project plan is reviewed and monitored.
The agile approach is different. Rather than creating work packages, you should break a product into features called epics or user stories. All of these stories are then placed onto a product backlog and prioritised from top to bottom. The top is the must-have functionality, while the less essential and nice-to-have features are moved to the bottom. Now you have a prioritised list, but it still does not help a management team understand how long it would take to implement those requirements.
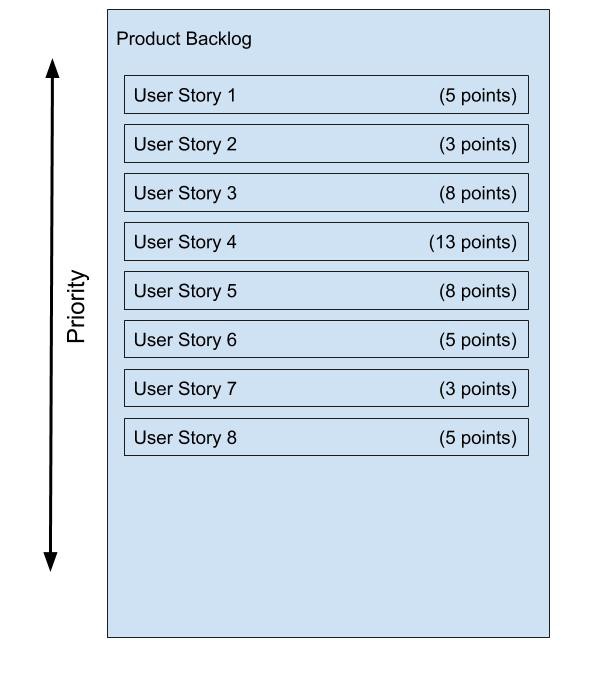
Product Backlog Example
The next step is for the scrum team to size each user story. The sizing itself happens in targeted workshops called backlog refinements. The business will provide a reasonable amount of details about each user story to the delivery team. The team, in turn, assesses the requirements and provides a size for each backlog item.
So how do we measure the stories and epics? Man-days, hours, or possibly sweat and tears? The answer is story points. Each story is assigned a number ranging from 0 to infinity, where 0 implying a well-timed sneeze could deliver it versus infinity, which equals to impossibility. Many agile teams prefer to use numbers from the Fibonacci sequence (0, 1, 2, 3, 5, 8, 13, 21) or a slightly modified Fibonacci sequence (1, 2, 3, 5, 8, 13, 20, 40, 100). The advantage of the points system is that it reflects the relative complexity of each story. A straightforward user story would get 3 points, while a slightly more complicated one would be measured as 5. A large and particularly complex epic would move more towards 13 or even 21 points. Every team has a unique take on the weighting. One group may size a feature as 8, while another may assign the very same feature 5 points. The main benefit of this approach is its relative nature - a story sized as 8 is much larger than a one that has 3 or 5 points.
Over time, any team gets a good sense of how many story points they can deliver in a given period, which is called the team's velocity. For example, my team can deliver 25 story points a week. It also helps a management team to understand the effort needed to implement requirements. In our case, they could expect a product backlog of 100 story points to take approximately four weeks to deliver.
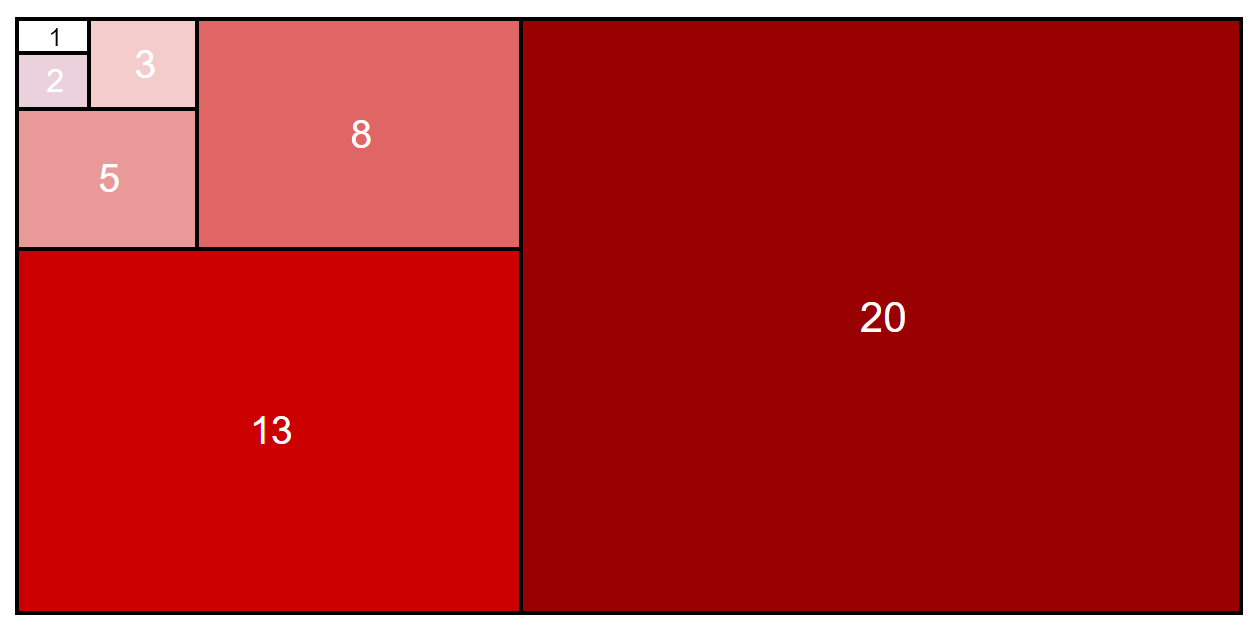
A visual representation of relative sizing
A few important things to keep in mind:
- The team delivering the user story should be the team sizing it.
- Involve the whole team in the sizing process, including designers, developers and testers.
- If a story is too complicated, it may well be an epic and should be broken into more manageable pieces.
The story points approach becomes a universal language that is spoken by both developers and business. The points help a business team understand the relative complexity of various stories, understand the difference in effort required to implement them. It also gives a business a clear view of what functionality can be delivered within a given time period.
Furthermore, this powerful method allows agile teams to adjust the delivery scope. They can swap a 5-point story for another one of a similar value or replace a complex 13-points epic for three smaller stories of 5 points each. This way, features become more modular and interchangeable, which, in turn, gives businesses more flexibility. In a world where adapting to change gives a competitive advantage, the story point approach fits in perfectly and plays its part exceptionally well.
Reference(s):
- Relative sizing visual: By 克勞棣 — Own work, CC BY-SA 4.0, https://commons.wikimedia.org/w/index.php?curid=38708516
.png)
-1.png)
